Product Design • Case Study • BQE Software
Rethinking the Report Center Experience
From a buried accordion list of 200+ reports to a personalized, template-driven workspace with live previews, folder organization, and scheduling — designed for the way professional services firms actually work.
Role
Product Designer (Lead)
Platform
BQE CORE Web App
Module
Reporting & Analytics
Timeline
Q2 - Q4 2025
Team
Product Manager, Stake Holders, Engineering
01 - Overview
BQE Core has over 200 standard reports. The majority of users were not able to find what they needed.
BQE Core serves architecture, engineering, and professional services firms of all sizes. Its Reports module was one of the platform's oldest surfaces and one of its most painful. A single accordion list of categorized report names, with no descriptions visible until you clicked, hidden preview of what the report would look like, and no way to save personalized configurations without memorizing a buried workflow.
The redesign introduced a new experience called the Report Center. A personalized home for your reports, built around folders, saved configurations, template previews, and scheduled delivery. The classic view remained available for power users who preferred it.
02 - The Problem
A report catalog that required you to already know what you were looking for.
Users ran reports constantly for billing, project management, employee tracking, financial review. But discovering the right report, configuring it, and getting back to it next week was an exercise in institutional memory. New hires couldn't figure it out. There was an influx of support tickets of users wanting a custom report or asking for an easier way to configure the report that they need. Even experienced users expressed frustration in interviews.
Before — Standard Reports List (Collapsed)
14 collapsed category groups, alphabetically sorted. No report descriptions, no previews, no saved configurations. Users had to expand each group, read names, and guess which applied to their use case.
Before — Expanded Category + Hover Menu
Expanding a group revealed report names with truncated descriptions. Actions like Memorize, Schedule, and Favorite lived in a row action menu that was undiscoverable for most users.
03 - Research
Six user interviews, a support ticket audit, and a usage data deep-dive.
I started with the support queue. Filtering tickets in Productboard I was able to surface over 340 tickets over a six-month period — roughly 18% of all product support volume. The majority fell into three clusters: "I can't find the report I need," "I don't know how to configure this report," and "I run the same report every week and it's tedious."
Along with the help of a Product manager, I then conducted six moderated user interviews across firm types and roles: two principal architects who ran reports monthly, two billing managers who used reports weekly, and two project managers who ran time and utilization reports for each billing cycle. Sessions were screenshared walkthroughs of their existing workflow using Microsoft Teams and Zoom.
Discovery Breakdown
1
Users couldn't rely on category names to orient them. "Billing" reports included things useful to project managers; "Project" reports were routinely used by finance. The taxonomy reflected the data model, not user intent.
Configuration friction
2
Every weekly report started from zero. Participants estimated spending 3–8 minutes per report just on filter configuration — time they described as "annoying but accepted." Most had no idea saved configurations were possible.
Preview gap
3
Users frequently ran a report, saw the output wasn't what they expected, cancelled, and tried a different one. 4 of 6 participants described selecting the wrong report at least occasionally, even after years of using the platform.
Scheduling unknown
4
When asked about automated report delivery, 5 of 6 participants said they weren't aware this was possible. One billing manager described manually exporting and emailing a report to her leadership team every Monday — a job the platform could have automated.
In card-sorting exercises, users consistently grouped reports by use case (payroll, collections, utilization, project status) rather than by data type. This directly informed the tag architecture in the redesign.
Tag-based filtering
5
04 - User Flows
Before and after: running a weekly report.
The original flow to run a configured report required 8–11 steps, with multiple points of confusion or backtracking. The redesigned flow reduces this to 3 steps for saved reports, and 5 steps for first-time configuration.
05 - Mid - Fidelity Exploration
Three structural directions, tested before a single pixel of hi-fi was designed.
Before moving to high fidelity, I built and tested three structural prototypes to answer the most important open question: how should the 200+ standard report templates relate to a user's personal saved reports? These were distinct problems with potentially different surfaces.
-
![]()
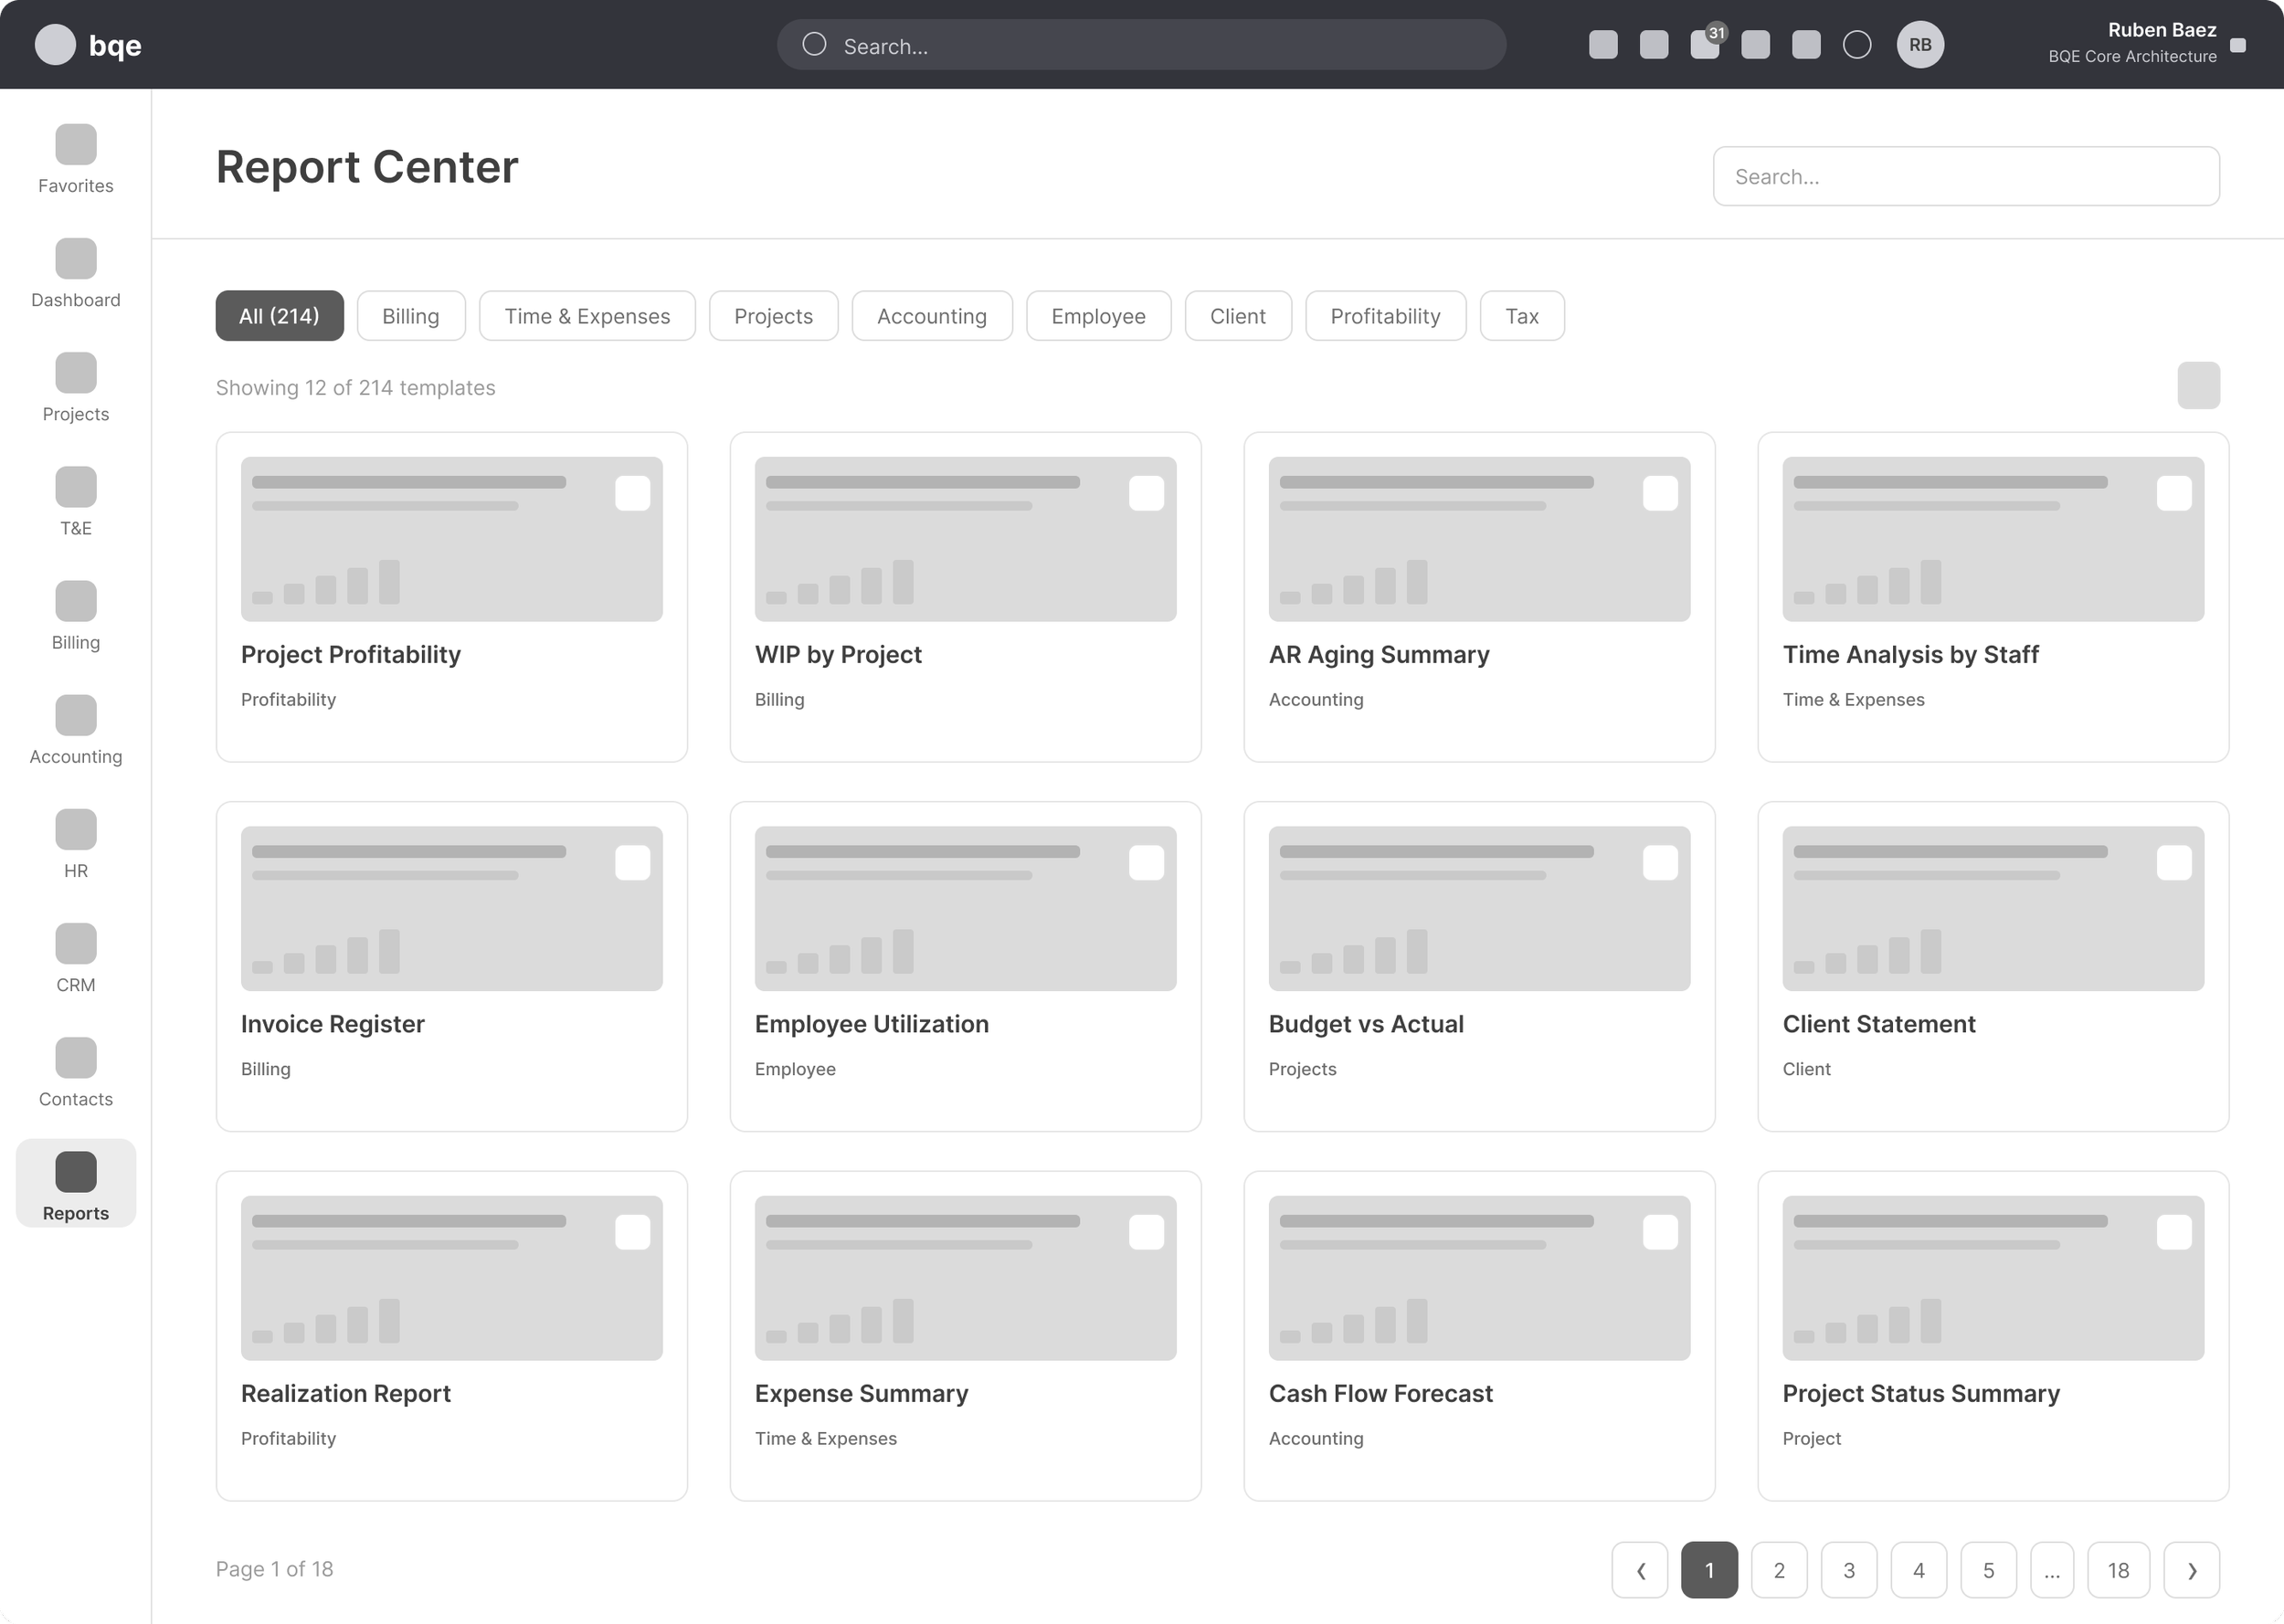
V1 Card gallery landing page
All 200+ templates shown as card tiles with tag filters across the top. Tested well for first-time discovery but felt overwhelming for returning users with established workflows. ✗ Rejected.
-
![]()
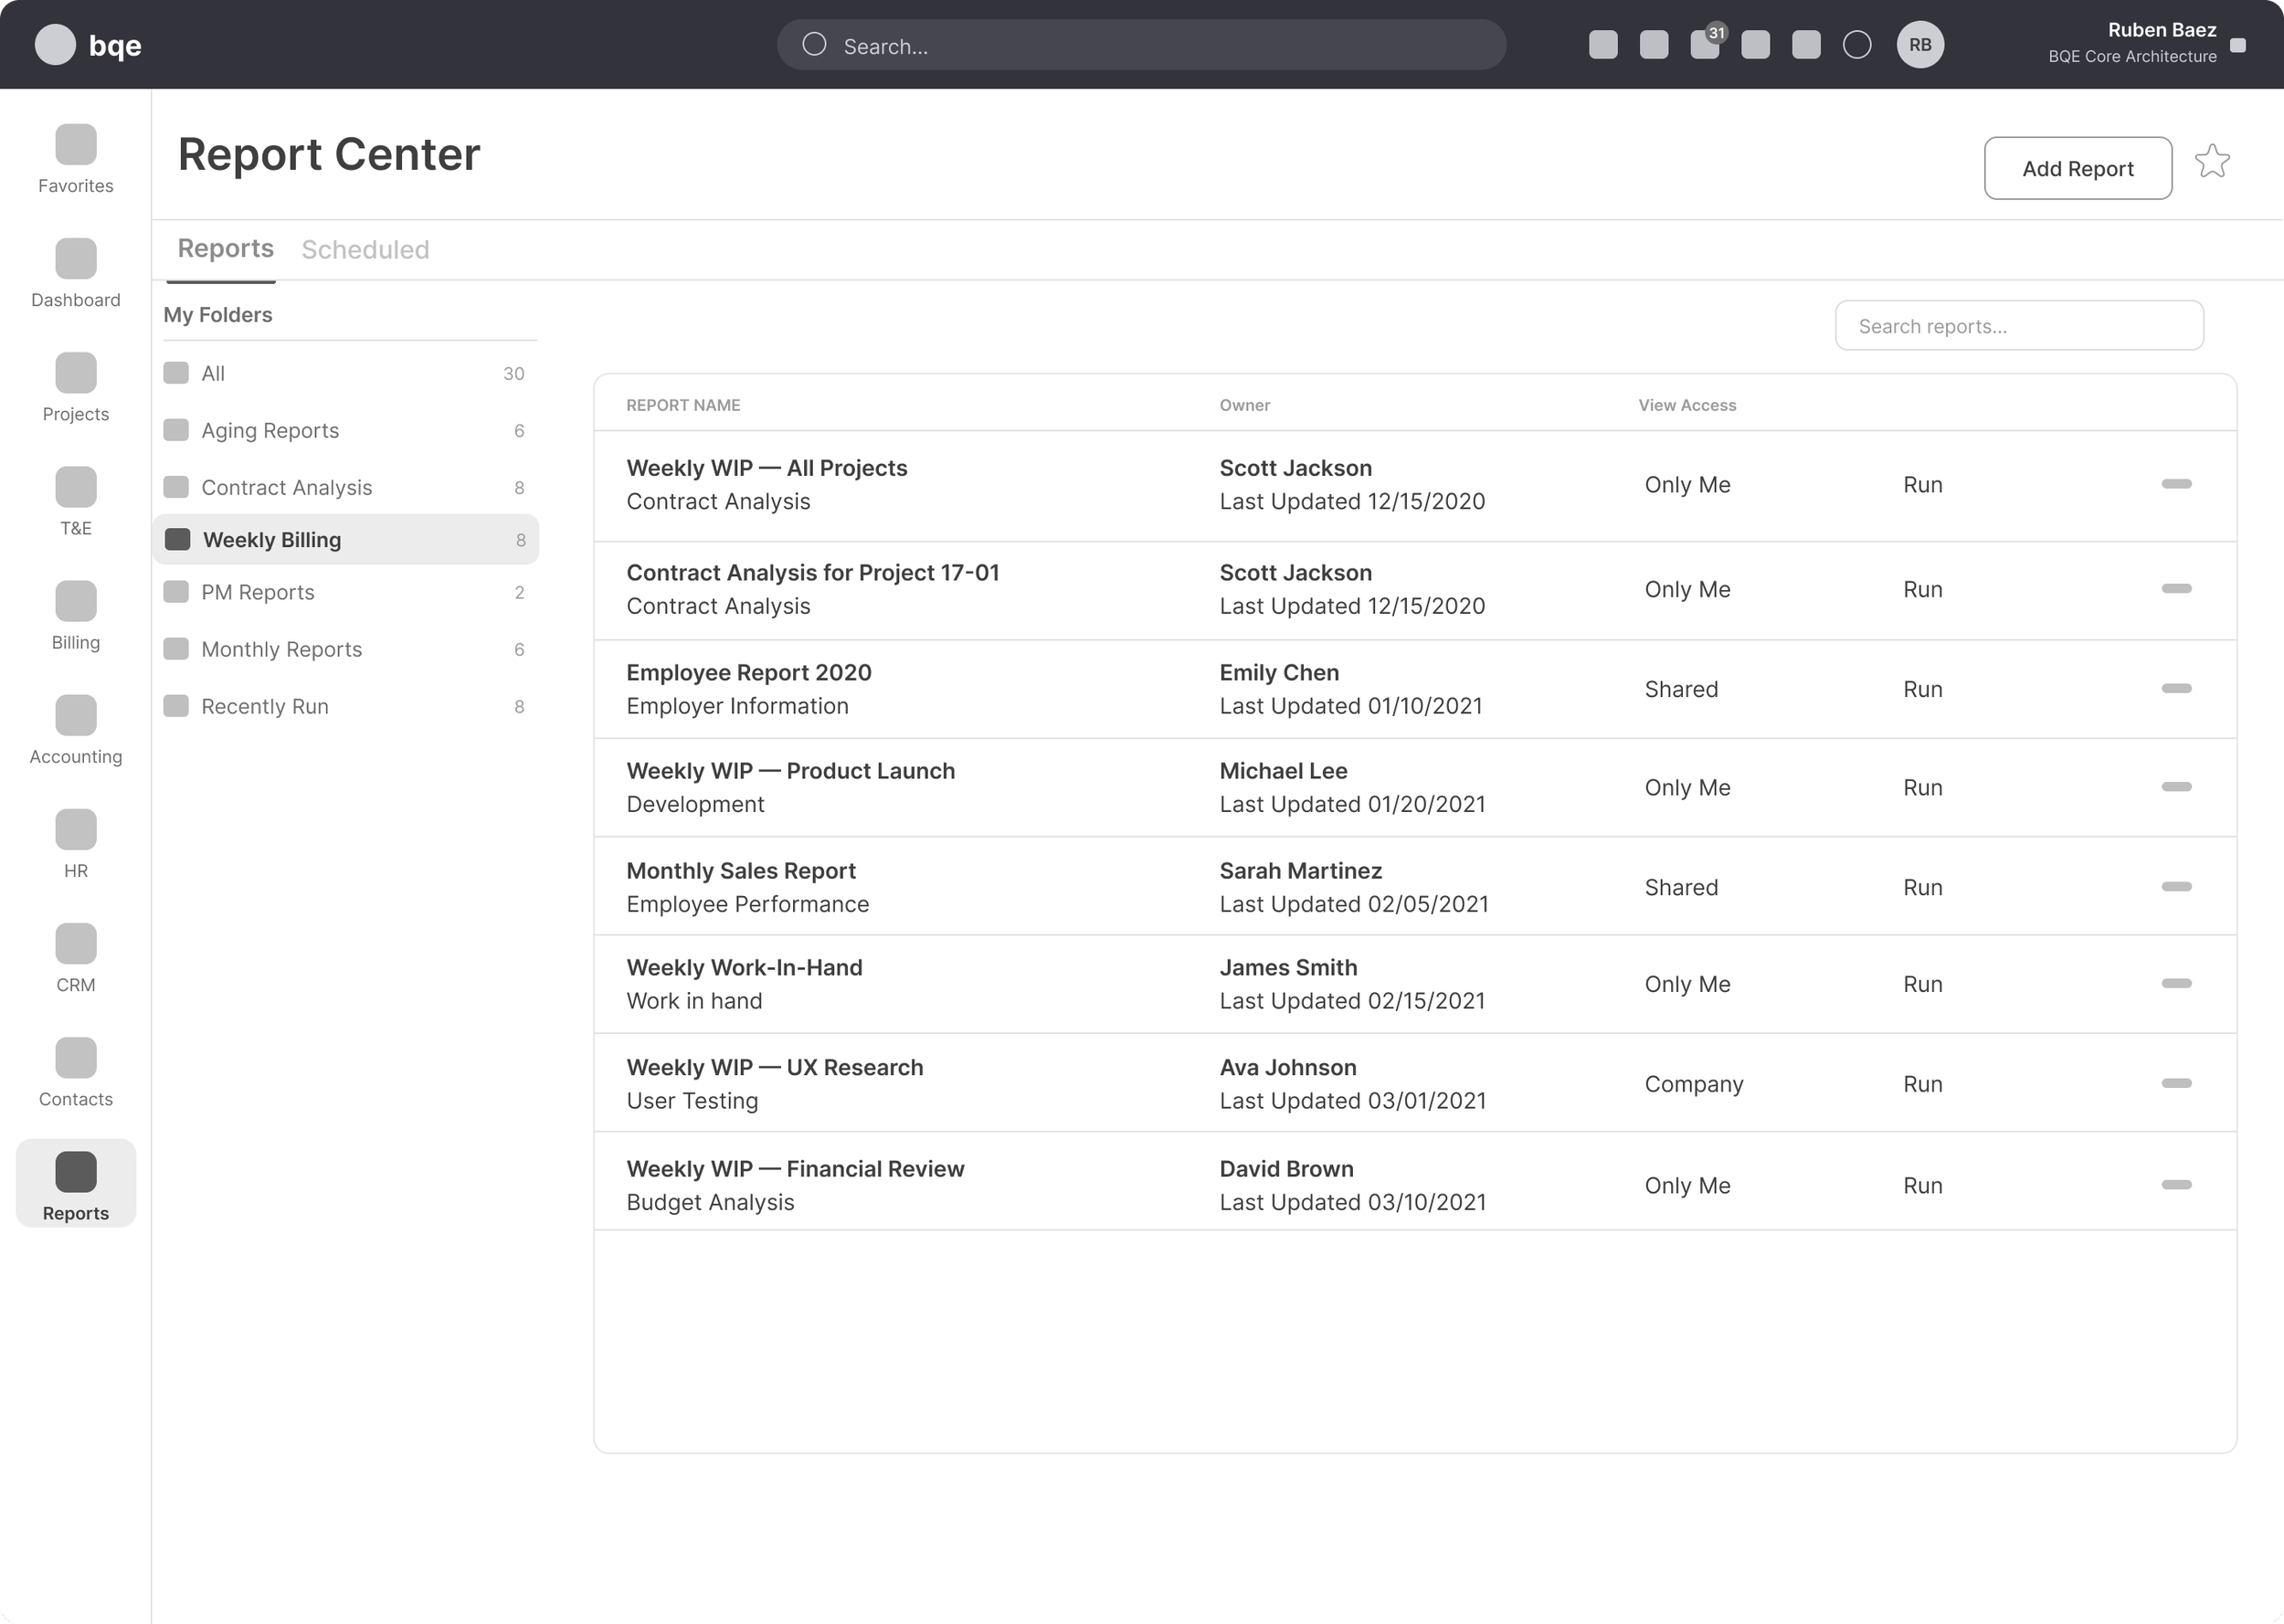
V2 Unified two tab approach
My Reports and All Templates as two tabs on one screen — folders on the left, report list on the right — keeping personal work cleanly separated from the standard library. It tested best of the three: the separation was immediately legible and the folders mirrored how teams already think. ✓ Selected for the final design.
-
![]()
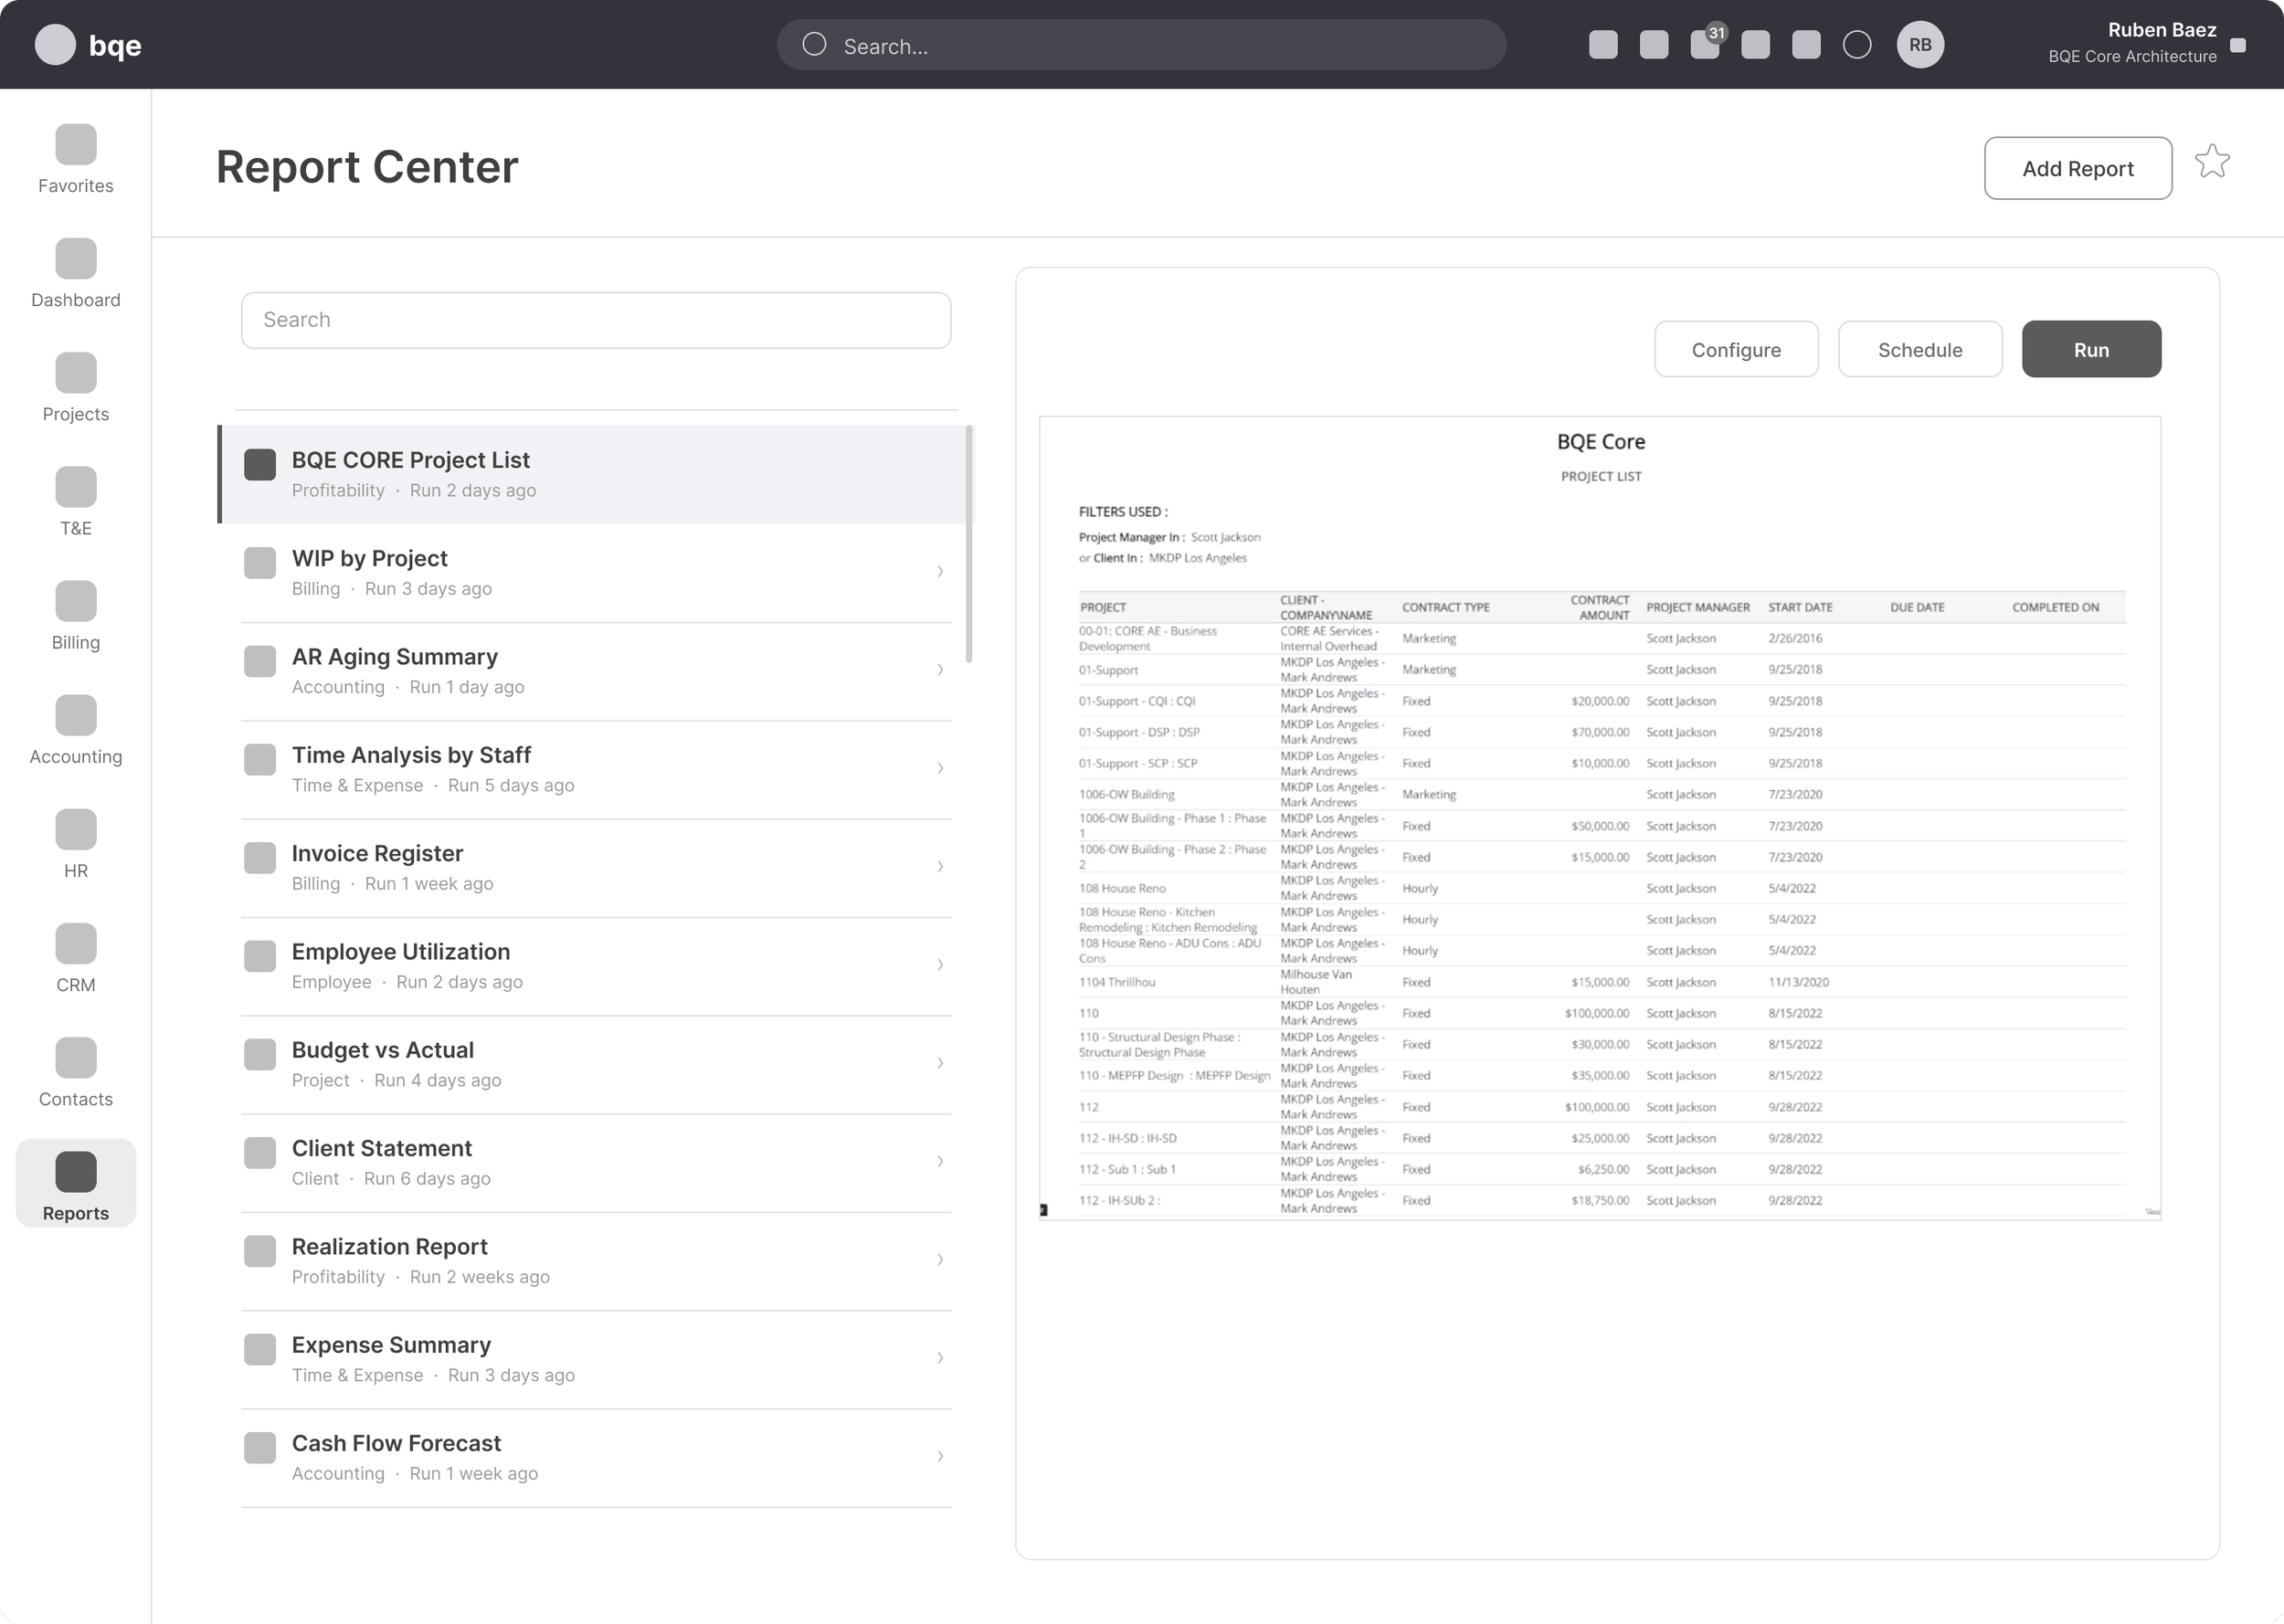
V3 Split pane explorer
Reports list on the left, live preview pane on the right that updated on hover. High delight in testing but too complex to build in scope; the preview concept was preserved in the Select Template flow instead. ✗ Deferred.
Key insights from testing
Mid-fi testing revealed that users strongly preferred folder organization over tags alone for their saved reports. Tags worked for discovery; folders worked for day-to-day access. Both made it into the final design.

06 - Final Designs
The redesigned Report Center.
The Report Center shipped as an opt-in "New Experience" with a visible "Switch to Classic View" escape hatch. This allowed gradual adoption without disrupting existing workflows. Internally, the project was split into three shipping milestones: the home view and folder system, the Select Template flow with previews, and the Configure Report + scheduling system.
After - Report Center Home
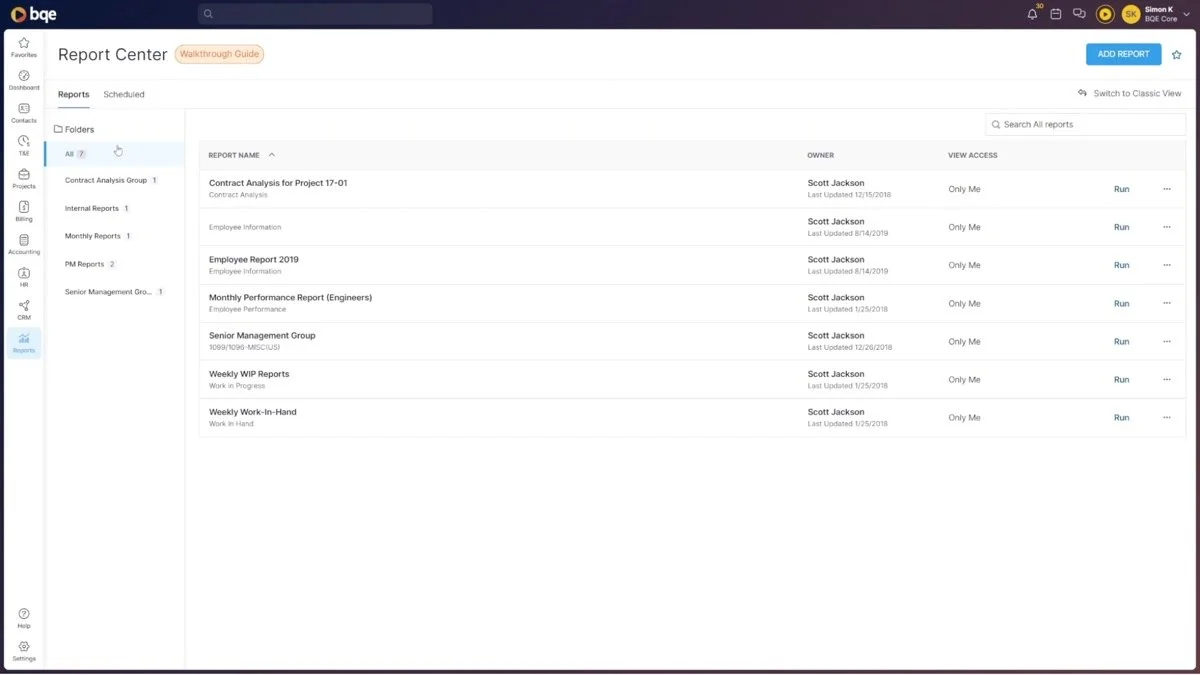
Report Center Home
Folder sidebar filters by saved group. Report name, template type, owner, last-updated date, and view access displayed at a glance. "Run" action always one click away.
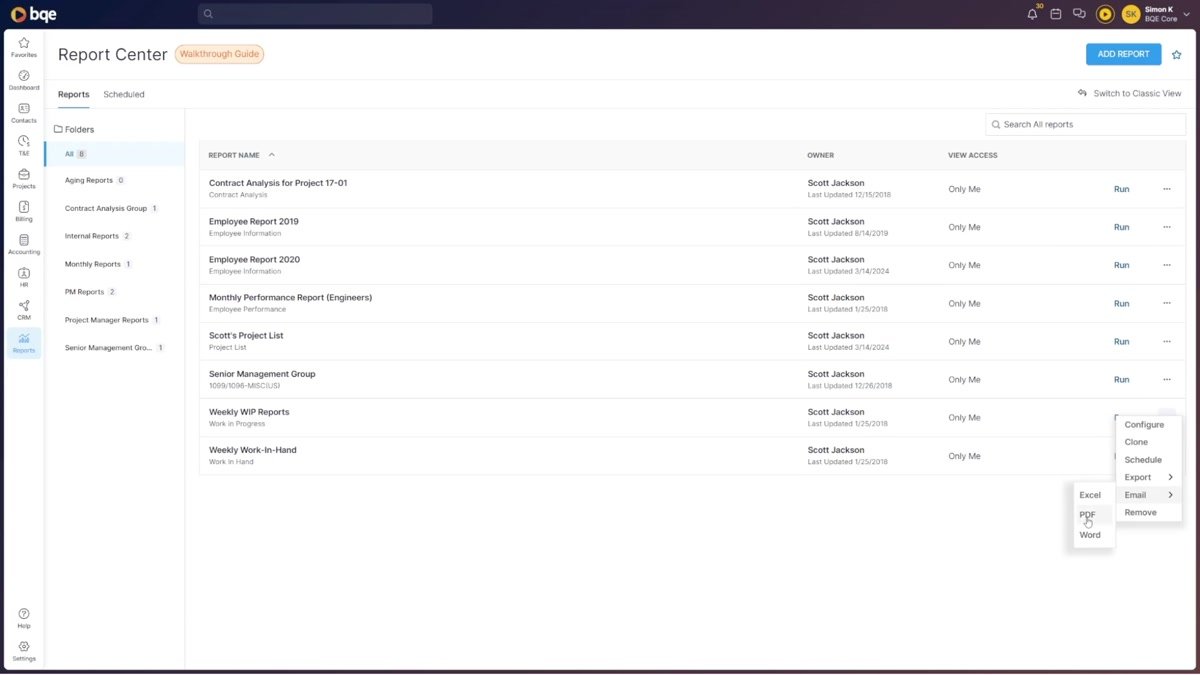
Report level actions
(Configure, Clone, Schedule, Export to PDF/Excel/Word, Email, Remove) surface in a visible overflow menu — no hovering required. Scheduling is now front-and-center, not hidden.
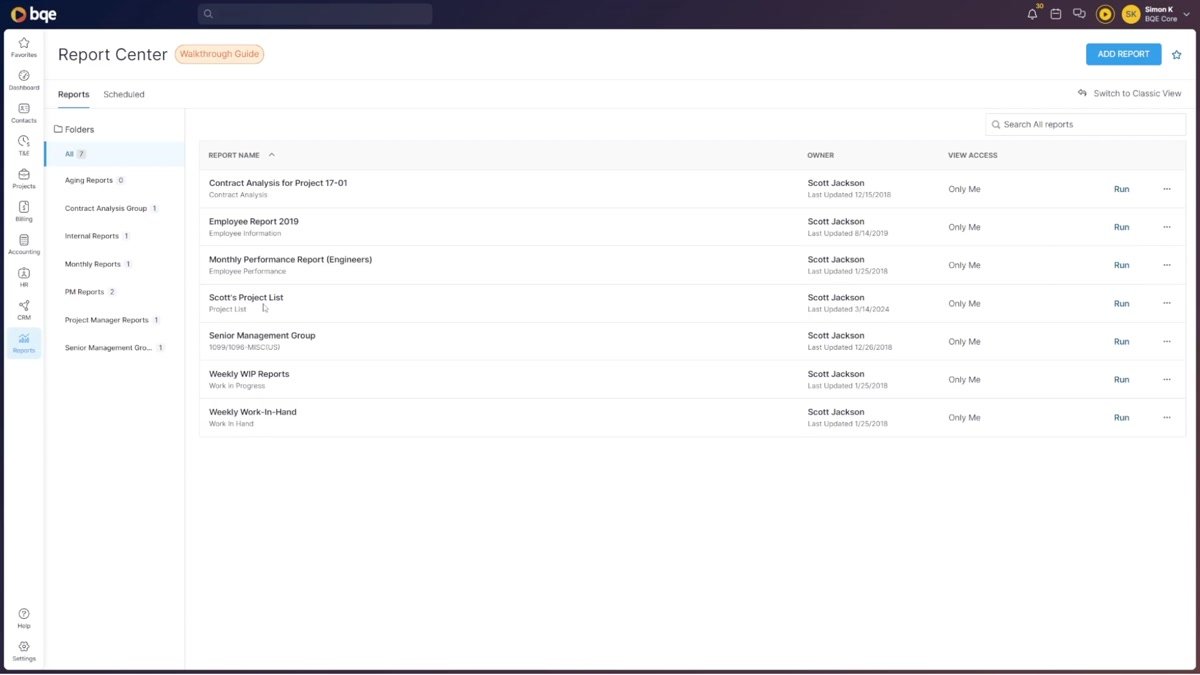
After saving a configured report
it appears immediately in the list with its folder assignment. No navigation required to return to it next week.
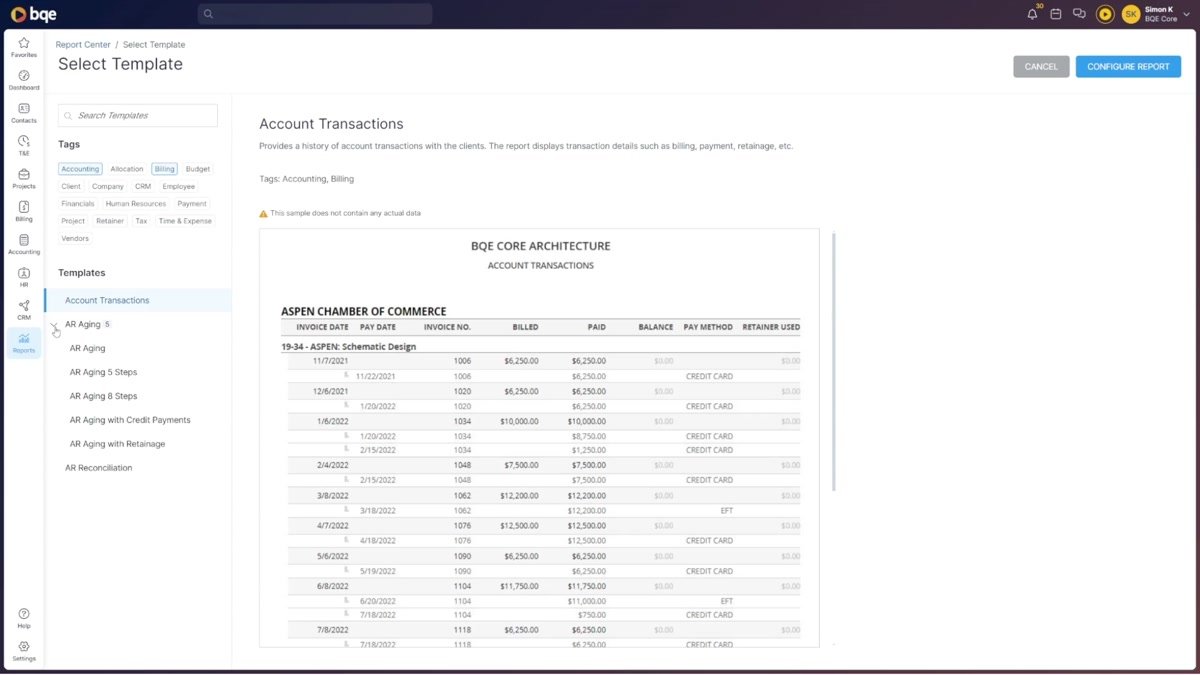
After - Select Template Flow
The template browser solves the "which report should I use?" problem. Tags across the left panel filter the template list; clicking a template shows a live sample preview in the main panel, so you know exactly what you're getting before committing.
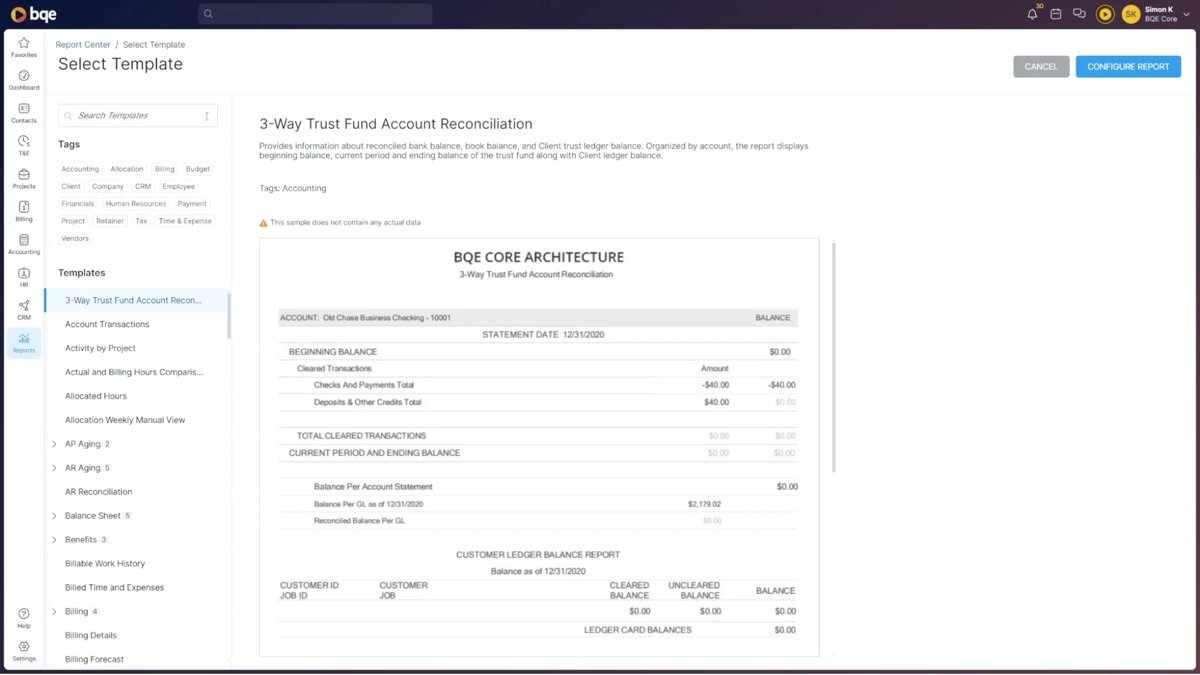
Live Sample Preview
Selecting a template immediately populates a live sample preview with the report structure, column headers, and anonymized data. Tag chips (Accounting, Billing, etc.) show at a glance what the report covers.
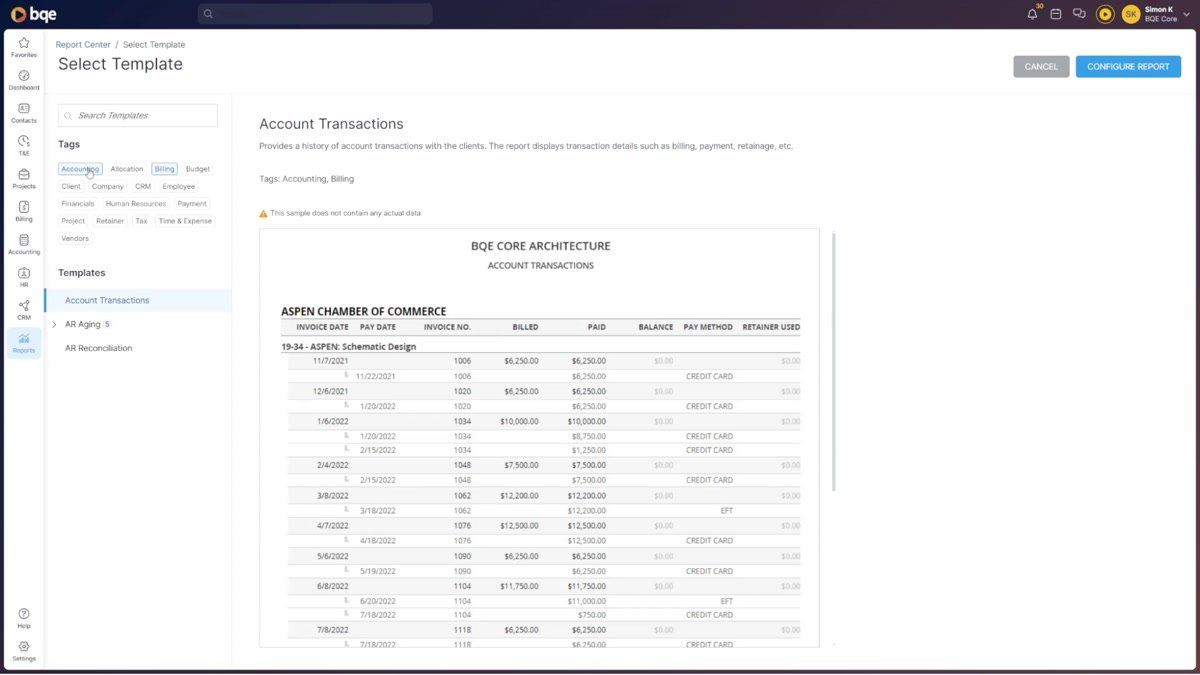
Keyword Search
Keyword search filters by report name and description, not just exact title. Results update live. Preview updates to the top match automatically.
Clicking a tag
Selecting a template immediately populates a live sample preview with the report structure, column headers, and anonymized data. Tag chips (Accounting, Billing, etc.) show at a glance what the report covers.
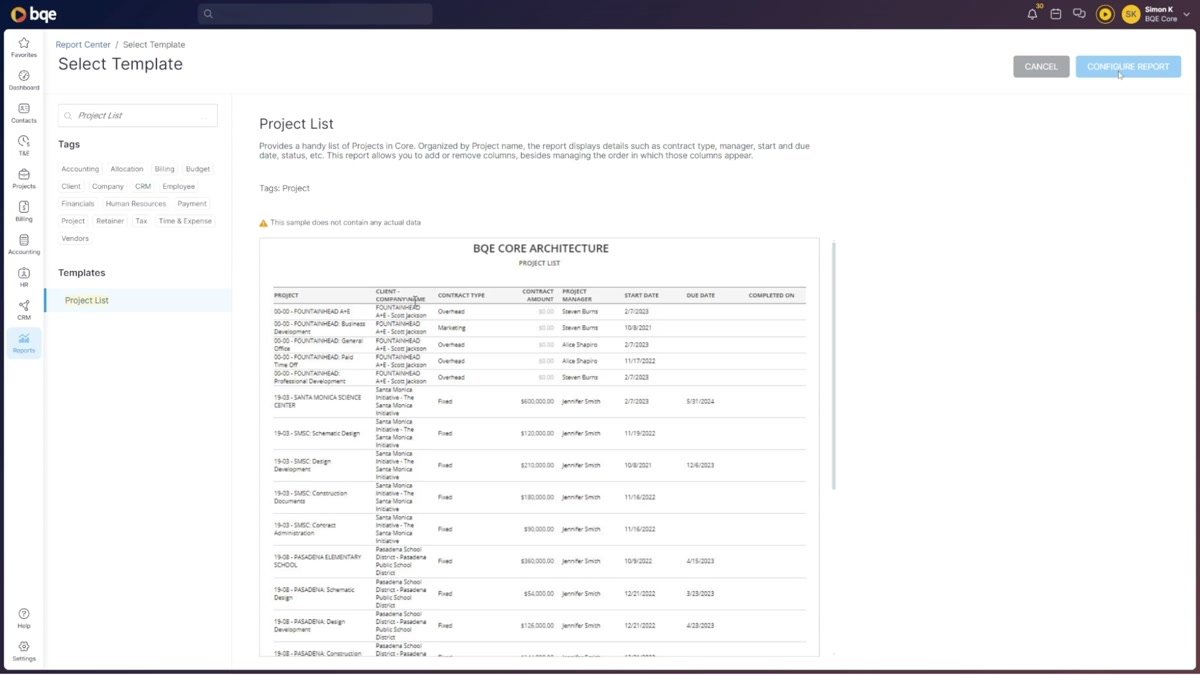
The Project list template preview
The Project List template preview shows all columns — contract type, project manager, start and due dates — so users know exactly what data they'll get before configuring.
After - Configure Report
The Configure Report screen gives each report a permanent name, assigns it to a folder, and sets its filters, display options, and view access — all on a single page, saved between sessions.
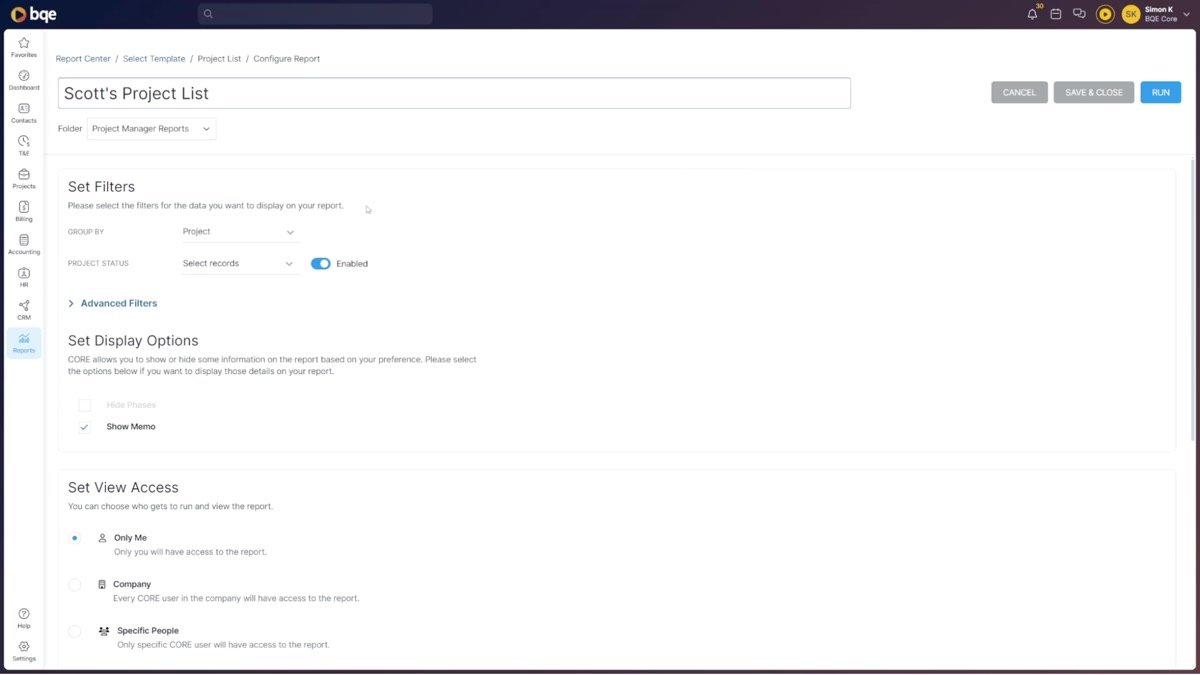
Basic Configuration
Basic configuration: report name, folder assignment, Group By, and Project Status filters. Display options (Hide Phases, Show Memo) and View Access (Only Me / Company / Specific People) complete the form.
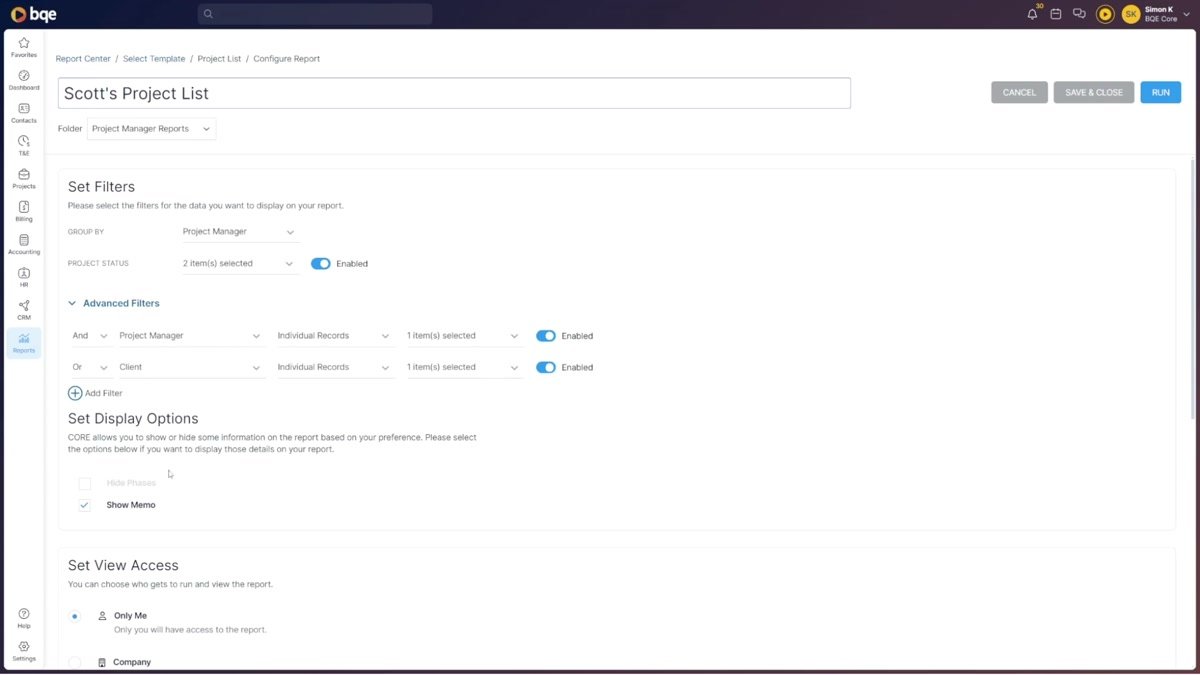
Advanced Filters
Advanced Filters support multi-condition logic with AND/OR operators, field selectors, individual record targeting, and per-filter enable/disable toggles — all without leaving the configuration page.
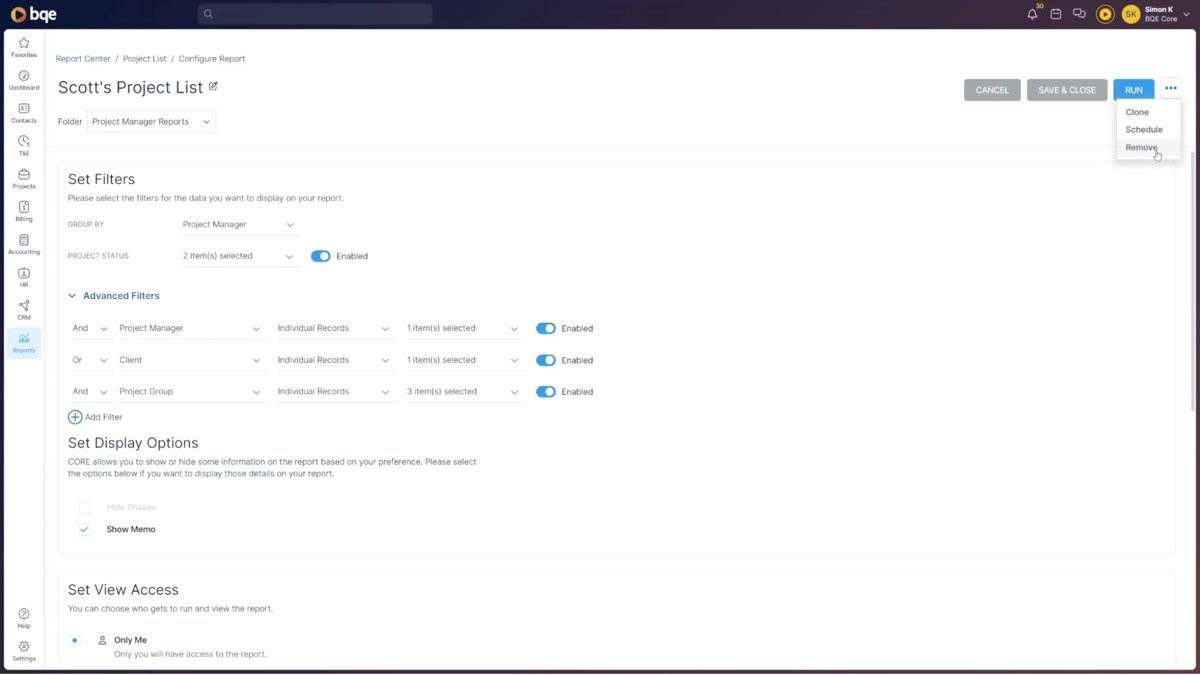
Consistent actions throughout
Consistent actions throughout. Clone, Schedule, and Remove are accessible from the Configure screen's overflow menu — keeping the same mental model whether you're editing a report or managing it from the home list.
07 - Design Desicions
Key choices and the reasoning behind them.
Classic view escape hatch
1
Users couldn't rely on category names to orient them. "Billing" reports included things useful to project managers; "Project" reports were routinely used by finance. The taxonomy reflected the data model, not user intent.
Template tags over category accordion
2
Every weekly report started from zero. Participants estimated spending 3–8 minutes per report just on filter configuration — time they described as "annoying but accepted." Most had no idea saved configurations were possible.
Live preview in template selection
3
Users frequently ran a report, saw the output wasn't what they expected, cancelled, and tried a different one. 4 of 6 participants described selecting the wrong report at least occasionally, even after years of using the platform.
Folders + tags, not folders OR tags
4
When asked about automated report delivery, 5 of 6 participants said they weren't aware this was possible. One billing manager described manually exporting and emailing a report to her leadership team every Monday — a job the platform could have automated.
In card-sorting exercises, users consistently grouped reports by use case (payroll, collections, utilization, project status) rather than by data type. This directly informed the tag architecture in the redesign.
The old "Memorize" feature saved a report configuration but made it nearly impossible to find again. The new Report Center treats every saved report as a named, folder-assigned, ownership-tracked object — with its own owner, last-updated timestamp, and view access setting. This is what made the "run your weekly report in 3 clicks" scenario possible.
Scheduling surfaced in the main list
5
Saved reports as first-class objects
5
08 - Video Walkthrough
Product Video Walkthrough
09 - Outcomes
What changed after the Report Center shipped.
Metrics were tracked across usability testing benchmarks, support ticket volume, in-app CSAT surveys, and behavioral analytics from the first 60 days post-launch.
54 %
Faster time to first successful report run — usability testing benchmark, 8 participants, same tasks compared before/after
71 %
Drop in "how do I find a report" support tickets in the 60 days following full rollout
3x
Increase in saved / configured report usage. Users now saved reports for reuse instead of configuring from scratch each session
4x
Increase in scheduled report delivery adoption — from near-zero to measurable daily use within 8 weeks of launch